Heavy computation
Drive several bounded workers and identify hot paths with counters and an EventPipe trace.
A failure lab in a container
The optional demo workload creates realistic but bounded diagnostic scenarios so every major Tracebag workflow can be evaluated without risking a production service.
Drive several bounded workers and identify hot paths with counters and an EventPipe trace.
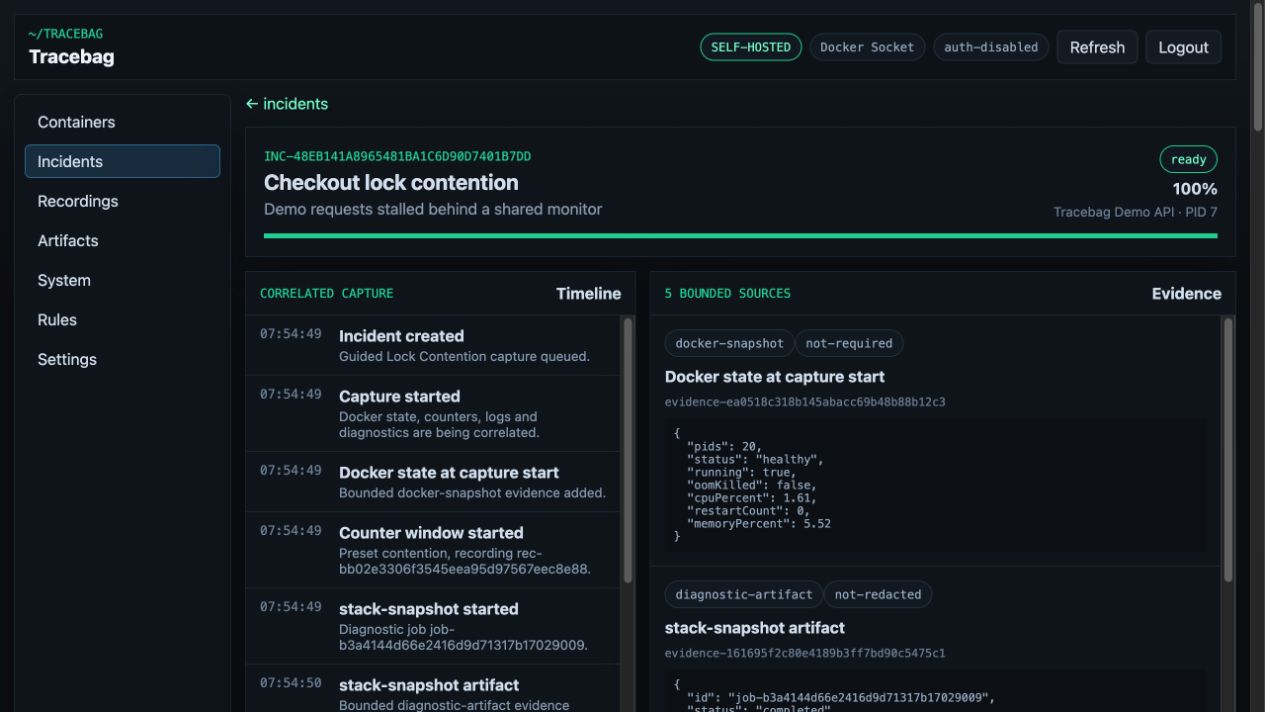
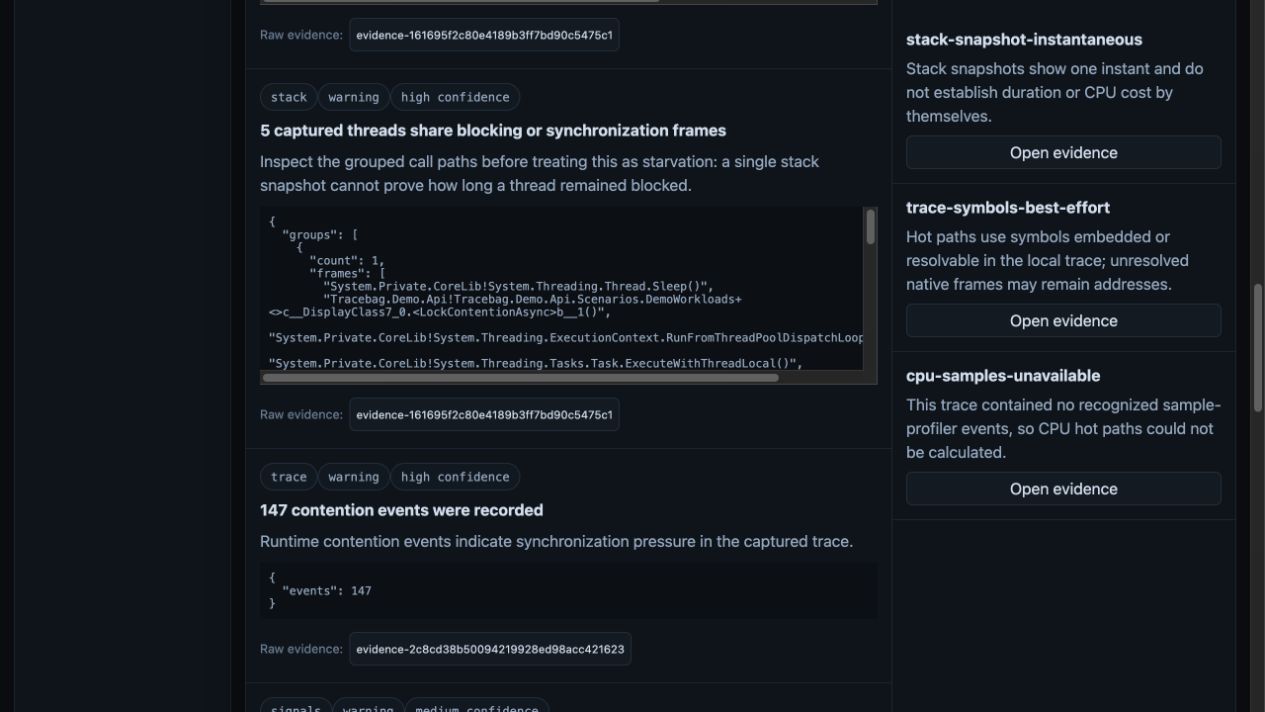
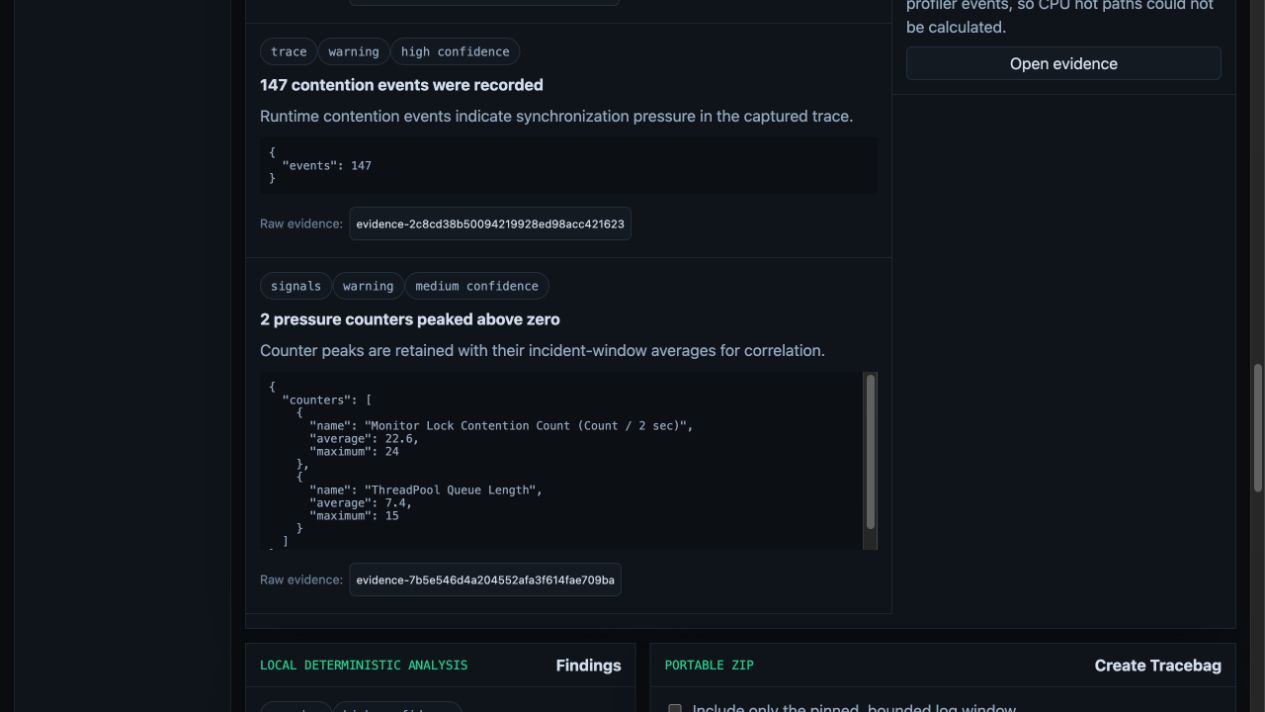
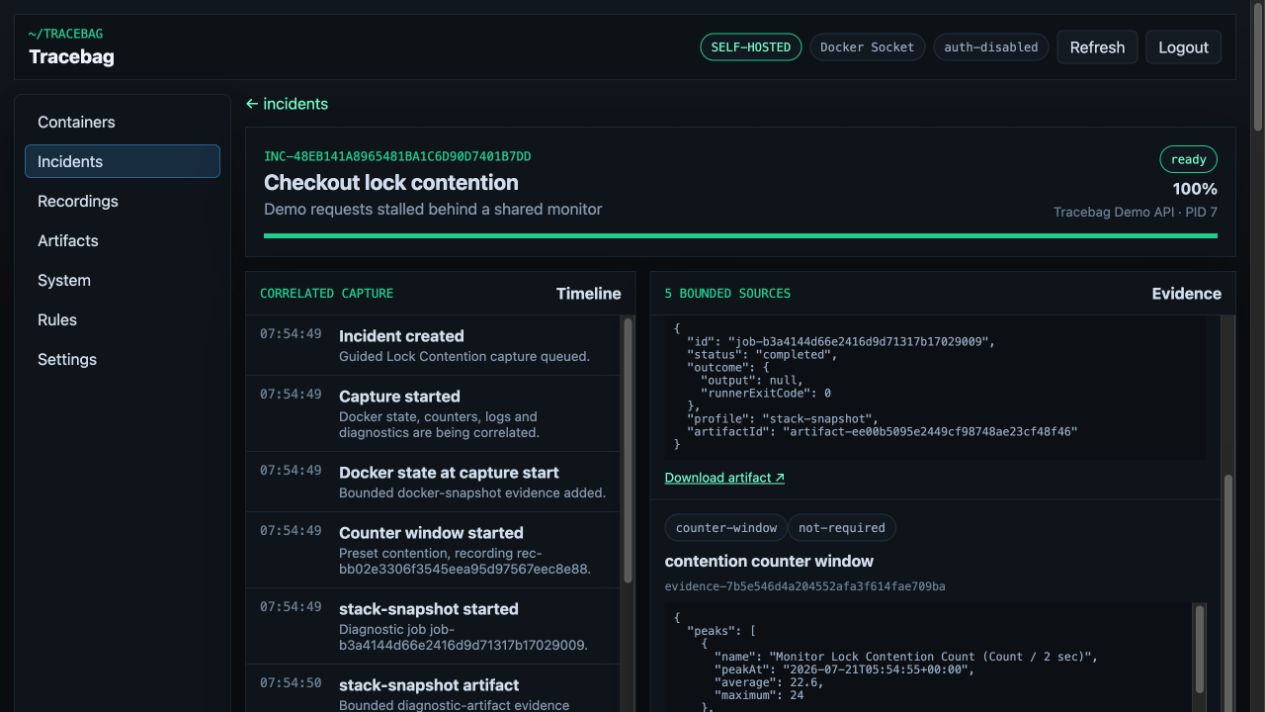
Stall requests behind a shared monitor and correlate queues, stacks, and contention events.
Block workers long enough to observe queue growth and slow request completion.
Create bounded allocations and inspect GC heap size, collection rate, and artifacts.
Generate structured errors and exceptions with consistent request correlation.
Add controlled latency while normal traffic continues in the background.
Published release
After completing the Docker quickstart, download the matching demo overlay and start the bounded workload:
curl -fsSLo compose.demo.yaml \
  https://raw.githubusercontent.com/poodlelab/tracebag/v${TRACEBAG_VERSION}/deploy/compose.demo.release.yaml

docker compose --env-file .env \
  -f compose.yaml -f compose.demo.yaml pull
docker compose --env-file .env \
  -f compose.yaml -f compose.demo.yaml \
  up -d --wait tracebag-postgres tracebag tracebag-demo-api
Tracebag opens at localhost:9090 and the demo control API at localhost:9091. Every synthetic workload has duration, resource, and concurrency caps plus a reset endpoint.
From a source checkout, ./scripts/demo-up.sh --traffic builds the same stack locally and adds normal background traffic.
Real capture